
What intact total RNA looks like
In most mammalian cells, total RNA is dominated by ribosomal RNA — roughly 80% of the mass. On a denaturing agarose gel (or a Bioanalyzer electropherogram), intact total RNA produces two sharp, bright bands:
- 28S rRNA — the upper, brighter band
- 18S rRNA — the lower, fainter band
In high-quality, intact RNA, the intensity ratio of 28S to 18S is approximately 2:1. The 28S band carries roughly twice the RNA (and binds roughly twice the dye) of the 18S band. Below these, the 5S rRNA and tRNA run as a small band near the bottom of the gel.
A clean 2:1 ratio is the classic “this RNA is fine” check. It correlates with high RIN values and — more importantly for practical purposes — with reliable results in qPCR, RNA-seq, and cloning.
Signature #1: the 28S:18S ratio inverts to 1:1 or 1:2
RNA degradation is not random. The 28S rRNA molecule is much larger than the 18S molecule (about 5,000 nucleotides vs. 1,900), and it contains several “fragile” sites where RNases and chemical hydrolysis cut first. This means 28S disappears faster than 18S.
| 28S:18S ≈ 2:1, sharp bands | Intact RNA — proceed with confidence |
| 28S:18S ≈ 1:1 | Moderate degradation — acceptable for some applications, risky for RNA-seq |
| 28S:18S ≈ 1:2, 28S barely visible | Severe degradation — most quantitative experiments are compromised |
| No distinct bands, only smear | RNA is gone — re-isolate |
If your 28S band is fainter than your 18S band, the RNA has been substantially degraded. There is no post-hoc rescue; the only correct decision is to go back to the sample.
Signature #2: the smear at the 5S position — the double confirmation
The second signature is easy to miss if you are only looking at the big bands: a thick, smeary band appearing at (and just above) the 5S position.
When the large rRNA molecules break apart, the fragments are heterogeneous in size — hundreds of random pieces from a few hundred bases down to a few dozen. On a gel, these fragments do not form a sharp band; they form a smear. The bulk of the smear migrates to the bottom third of the lane, right where the small 5S rRNA (~120 bases) runs. The result is that the 5S region looks abnormally dense and smeared — not a clean thin band.
When you see both signatures together — an inverted 28S:18S ratio and a heavy smear at the 5S position — that is a double confirmation of severe degradation.
A real lab example
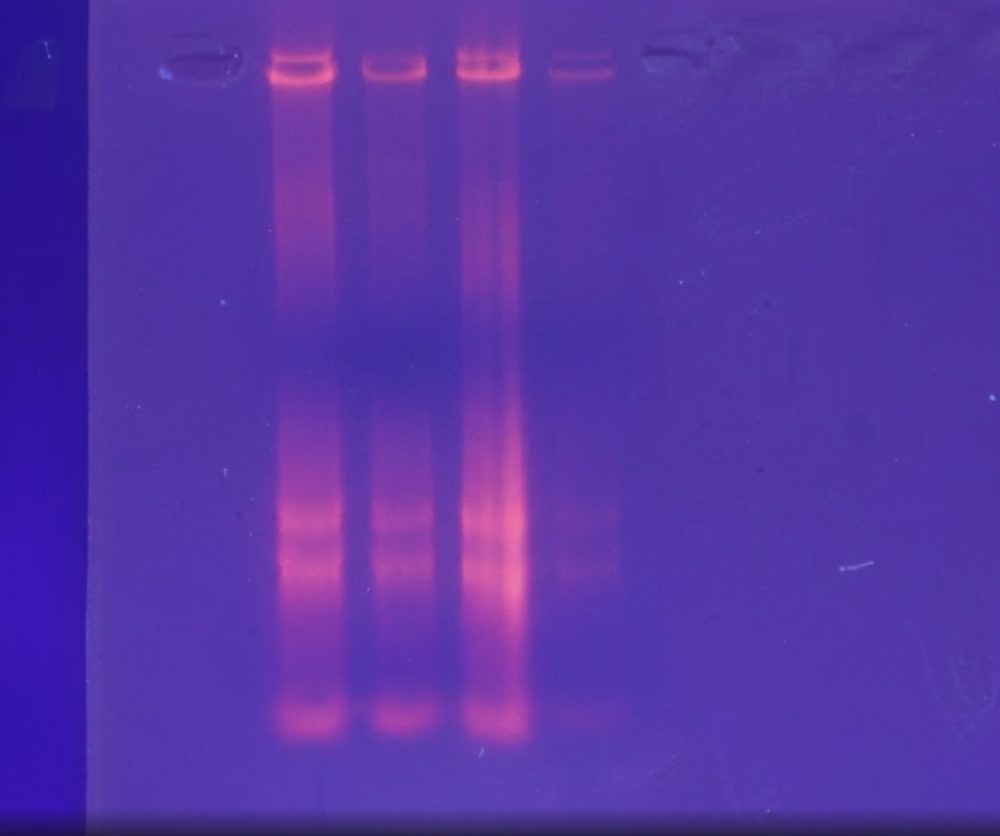
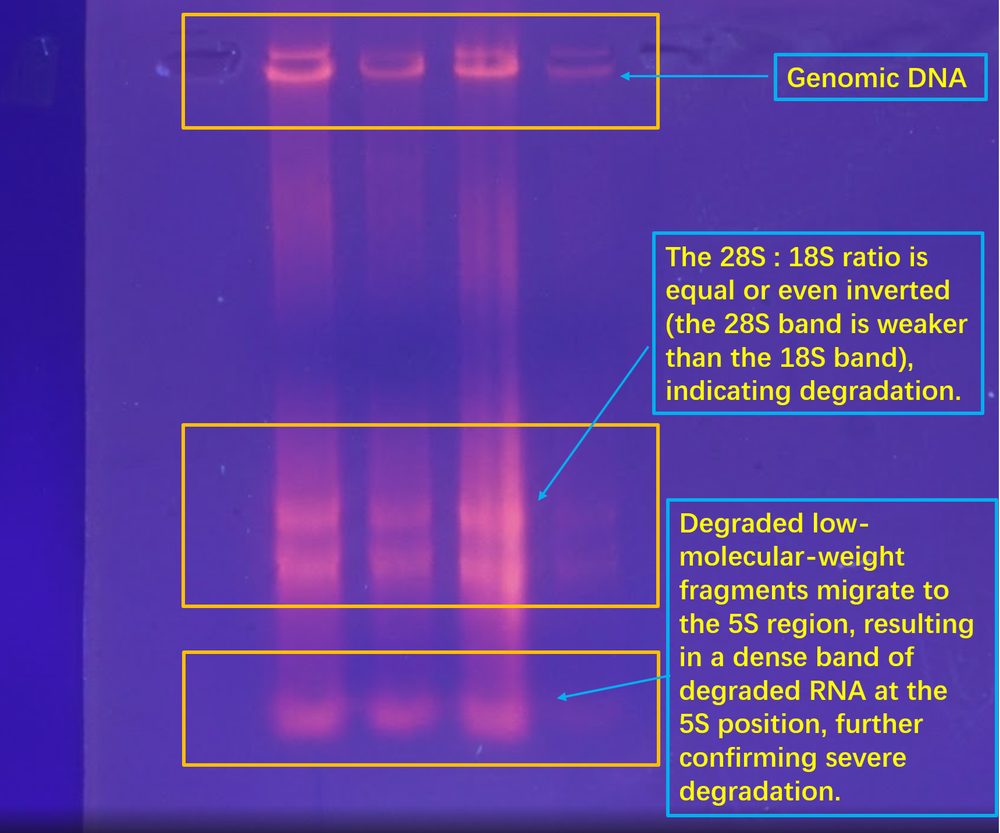
Below is a gel image from an actual total RNA run in our lab. The first image is the original result; the second is annotated the way we read it.
How to read it, step by step (video below):
- The top band is genomic DNA contamination — a check we always do before judging the rRNA bands, so we don’t mistake gDNA for intact RNA.
- The 28S and 18S bands are not at a 2:1 ratio. The 18S band is at least as intense as the 28S band — a 1:1 (borderline 1:2) appearance.
- The 5S position is not a clean small band. It is a dense smear of small degradation fragments.
- Conclusion: severe degradation. This RNA sample would be rejected for RNA-seq and treated with extreme caution even for routine RT-PCR.
How to read a gel in ten seconds
- Find the 28S band. Is it clearly brighter than 18S? Good.
- Check the bottom of the lane. Is the 5S area a sharp thin band, or a broad smear? Smear = fragments = degradation.
- Check the very top. A bright band at the top is usually genomic DNA contamination — treat it separately (DNase treatment, minus-RT control).
- Photograph early. Over-exposed or long-developed images flatten intensity differences and hide the 1:1 vs 2:1 distinction.
What causes degradation, and how to prevent it
- RNase contamination — the #1 cause. RNases are everywhere: fingers, dust, bench surfaces, non-certified tubes and tips.
- Poor sample handling — thawing and refreezing, prolonged room-temperature incubation, vortexing too aggressively.
- Improper storage — RNA in water or TE at 4°C instead of −80°C, repeated freeze–thaw cycles.
- Inadequate stabilization — tissues that are not immediately stabilized after harvest are the classic source of degraded samples in field studies and clinical-adjacent research.
Practical countermeasures that cost little and work:
- Use RNase-free certified consumables and dedicated pipettes. Wear gloves and change them frequently.
- Stabilize samples at the point of harvest. For tissue samples, an RNA stabilization reagent — such as our CYRN15 RNAfixer — protects RNA in the field, during collection, or during transport, before the sample ever reaches the bench.
- Check every RNA prep on a gel (or Bioanalyzer) before spending a week on downstream work. Ten minutes at the gel bench saves ten days of bad data.
Frequently asked questions
Q: Is a 1:1 28S:18S ratio always degradation?
No — some organisms and some tissues naturally deviate from 2:1, and insect RNA in particular shows a different pattern. But for mammalian/cultured-cell total RNA, 1:1 should trigger a hard look at the sample.
Q: Can degraded RNA still be used for RT-PCR?
Sometimes, if the target amplicon is short (≤200 bp) and the degradation is moderate. Design primers that amplify small fragments and always validate with a minus-RT control. For RNA-seq and long-read applications, no.
Q: What does the smear at 5S mean if the 28S/18S ratio looks fine?
Mild degradation of a minor RNA fraction, or overloading of the gel. Re-run with less sample and check again.
Q: Does gel type matter?
Yes. Denaturing gels (formaldehyde or glyoxal) resolve rRNA bands properly; non-denaturing gels let secondary structure smear the picture. The signatures above assume a standard denaturing total RNA gel.
All products mentioned are for research use only (RUO). Not for diagnostic, therapeutic, or clinical use.
Related gel and RNA quality guides
- 28S:18S rRNA ratio and band sizes
- Reading RNA integrity on agarose gel
- mRNA on agarose gel: smears and bands
- How to run RNA on a standard agarose gel
- RNA gel troubleshooting: extra bands, smears and odd sizes
- Genomic DNA quality on agarose gel
- A260/A280 for RNA: the complete guide
Related products: RNApure Total RNA Kit (CYRN03) | Plus RNA Mini Kit (CYRN28) | RNAfixer RNA Stabilization Solution | All RNA & DNA extraction kits | Request a quote